SOLAR ULTRAVIOLET MEASUREMENTS OF EMITTED RADIATION
There is a version in German language for some of these pages.
Es gibt eine deutschsprachige Version für einige dieser Seiten.
- Descriptions:
Instrument and reduction of SUMER Data |
SUMER Investigation |
SUMER Performance Characteristics
- Participation:
SUMER Institutions |
SUMER Team |
Pictures from Workshops
- Data:
SUMER Data and Analysis resources |
SUMER File Catalogue |
SUMER Image data base
- Data reduction:
Data Corrections Cookbook |
Radiometric Calibration and Corrections |
- Reference information:
SUMER Spectral Line List (the Atlas) |
Disk Atlas (PDF) |
Coronal Atlas (PDF)
- Special Information for observers:
Operations Guide |
Coordinates |
Weekly Planners
- History:
Pre-launch images |
Launch |
Commissioning |
SOHO Recovery
- Campaigns:
Doppler Shifts in X-ray Jets 1999/2000 |
JOP104 Papers |
Flare Watch 2001 |
2002
- Publications: SCIENCE Publications | Wavelength measurements
| SUMER Atlas of Solar Images
MPS database: List of SUMER-publications with MPS authors
List of publications with SUMER-Data up to 2005
- Results:
SUMER Picture Gallery |
SUMER Slide Shows |
SOHO Hot Shots with SUMER
- Press Releases:
21 Aug 2001 |
27 Jun 2002 |
ESA 22 APR 2005
- Home Pages: MPS | ESA | NASA | GSFC | SOHO
Welcome to the SUMER pages, based at the Max Planck Institute for Solar System Research (MPS). SUMER is a VUV telescope and spectrometer, designed and built at this institute from 1987 to 1995 with international cooperation. It is now an instrument on board the ESA/NASA spacecraft SOHO, which was launched on 02 December 1995. Since the beginning of 1996, SUMER operates on SOHO at a distance approximately 1.5 million kilometers from Earth towards the Sun and delivers research data about the solar atmosphere that are analysed and archived at MPS and other institutions. SUMER has now been put in hibernation since August 2014.
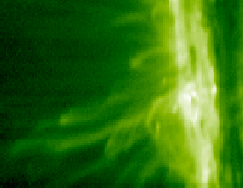
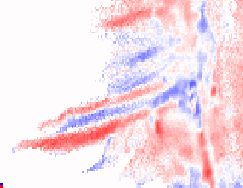
Example: SUMER raster scan of magnetic loops


The structure of magnetic loops over an active region at the solar limb, observed by SUMER on 06 May 1996. Left: Intensity image of the emission line O VI 1037, formed in the transition region at a temperature around 300 000 K. Right: Doppler shift image of the same line; blue denotes movement towards the observer, red denotes movement away from the observer. More examples in the SUMER Picture Gallery and the SUMER Slide Shows.
09 APR 2015 (Udo Schühle)
No comments:
Post a Comment