Download a pdf of this Backgrounder
Related Publications:
Teleconference Transcript
George J. Borjas has been described by both
Business Week and the
Wall Street Journal
as “America’s leading immigration economist”. He is the Robert W.
Scrivner Professor of Economics and Social Policy at the Harvard Kennedy
School. He is the recipient of the 2011 IZA Prize in Labor Economics.
Professor Borjas is also a Research Associate at the National Bureau of
Economic Research and a Research Fellow at IZA. Professor Borjas is the
author of several books, including
Heaven’s Door: Immigration Policy and the American Economy (Princeton University Press, 1999), and the widely used textbook
Labor Economics
(McGraw-Hill, 2012), now in its sixth edition. He has published over125
articles in books and scholarly journals. He received his Ph.D. in
economics from Columbia University in 1975.
Executive Summary
At current levels of around one million immigrants per year,
immigration makes the U.S. economy (GDP) significantly larger, with
almost all of this increase in GDP accruing to the immigrants themselves
as a payment for their labor services.
For American workers, immigration is primarily a redistributive
policy. Economic theory predicts that immigration will redistribute
income by lowering the wages of competing American workers and
increasing the wages of complementary American workers as well as
profits for business owners and other “users” of immigrant labor.
Although the overall net impact on the native-born is small, the loss or
gain for particular groups of the population can be substantial.
The best empirical research that tries to examine what has actually
happened in the U.S. labor market aligns well with economy theory: An
increase in the number of workers leads to lower wages. This report
focuses on the labor market impact of immigration.
Immigration also has a fiscal impact — taxes paid by immigrants minus
the costs they create for government. The fiscal impact is a separate
question from the labor market impact. This report does not address the
size of the fiscal impact.
Findings
The Standard “Textbook” Model
- The presence of all immigrant workers (legal and illegal)
in the labor market makes the U.S. economy (GDP) an estimated 11
percent larger ($1.6 trillion) each year. This “contribution” to the
aggregate economy, however, does not measure the net benefit to the
native-born population.
- Of the $1.6 trillion increase in GDP, 97.8 percent goes to the
immigrants themselves in the form of wages and benefits; the remainder
constitutes the “immigration surplus” — the benefit accruing to the
native-born population, including both workers, owners of firms, and
other users of the services provided by immigrants.
- The standard textbook model of a competitive labor market yields an
estimate of the immigration surplus equal to $35 billion a year — or
about 0.2 percent of the total GDP in the United States — from both legal and illegal immigration.
- The immigration surplus of $35 billion comes from reducing the wages
of natives in competition with immigrants by an estimated $402 billion a
year, while increasing profits or the incomes of users of immigrants by
an estimated $437 billion.
- Three key results are implied by the standard economic model: (1) if
there are no wage losses, then there is no immigration surplus; (2) the
redistribution of income is much larger than the surplus; and, (3) the
size of the net benefit accruing to natives is small relative to GDP.
Illegal Immigration
- Applying the standard textbook model to illegal immigration
shows that illegal immigrants increased GDP by $395 to $472 billion. As
before, this “contribution” to the economy does not measure the net
benefit to natives.
- The immigration surplus or benefit to natives created by illegal immigrants is estimated at around $9 billion a year or 0.06 percent of GDP — six one-hundredths of 1 percent.
- Although the net benefits to natives from illegal immigrants
are small, there is a sizable redistribution effect. Illegal immigration
reduces the wage of native workers by an estimated $99 to $118 billion a
year, and generates a gain for businesses and other users of immigrants
of $107 to $128 billion.
- The above estimates are generated by the presence of additional
workers in the labor market, not by the legal status of those workers.
Measuring the Effects of Immigration Directly
- Early research measuring the labor market impact of immigration
focused on comparing outcomes in different cities. This approach is now
seen as inadequate because the movement of goods, labor, and capital
tends to diffuse the impact of immigration across the country.
- Classifying workers by education level and age and comparing
differences across groups over time shows that a 10 percent increase in
the size of an education/age group due to the entry of immigrants (both
legal and illegal) reduces the wage of native-born men in that group by
3.7 percent and the wage of all native-born workers by 2.5 percent.
- The results from the education/age comparisons align well with what
is predicted by economic theory. Further support for the results from
the education/age comparisons can be found in studies using the same
method in other countries.
- A theory-based framework predicts that the immigrants who entered
the country from 1990 to 2010 reduced the average annual earnings of
American workers by $1,396 in the short run. Because immigration (legal
and illegal) increased the supply of workers unevenly, the impact varies
across skill groups, with high school dropouts being the most
negatively affected group.
- The same type of education/age comparison used to measure the wage
impact shows that a 10 percent increase in the size of a skill group
reduced the fraction of native-born blacks in that group holding a job
by 5.1 percentage points.
- Immigration has its largest negative impact on the wage of native
workers who lack a high school diploma, a group that make up a modest
(and, in recent decades, shrinking) share of the workforce. These
workers are among the poorest Americans. The children of these workers
make up a disproportionate number of the children in poverty: 24.8
percent of all children of the native-born working poor live in
households headed by a high school dropout.
Findings from Recent Studies: Could All Americans Gain from Immigration?
- Some research argues that virtually all American workers gain from
immigration because immigrants and native workers with the same level of
education and age do not compete with each other, but in fact
complement each other. Although the early empirical studies that
examined this assumption claimed that there were substantial
complementarities, the published version of these studies reports much
weaker, if any, complementarities (Ottaviano and Peri, 2006 and 2012;
Borjas, Grogger, and Hanson, 2012).
- In fact, even if the extent of complementarity is at the upper end
of the estimated range in the most recent studies, immigration still
reduced the wage of native high school dropouts by between 2 to 5
percent (depending on whether the effect is measured in the long run or
the short run).
- Some studies also argue that native high school dropouts and high
school graduates are interchangeable in the workplace (Card, 2009;
Ottaviano and Peri, 2012). If true, the impact of immigration on the
relative size of the low-skill workforce is small and the wage impact of
immigration is correspondingly small. The data, however, do not provide
convincing evidence that high school dropouts and high school graduates
are, in fact, interchangeable (Borjas, Grogger, and Hanson, 2012).
Conclusion
Economists have long known that immigration redistributes income in
the receiving society. Although immigration makes the aggregate economy
larger, the actual net benefit accruing to natives is small, equal to an
estimated two-tenths of 1 percent of GDP. There is little evidence
indicating that immigration (legal and/or illegal) creates large net
gains for native-born Americans.
Even though the overall net impact on natives is small, this does not
mean that the wage losses suffered by some natives or the income gains
accruing to other natives are not substantial. Some groups of workers
face a great deal of competition from immigrants. These workers are
primarily, but by no means exclusively, at the bottom end of the skill
distribution, doing low-wage jobs that require modest levels of
education. Such workers make up a significant share of the nation’s
working poor. The biggest winners from immigration are owners of
businesses that employ a lot of immigrant labor and other users of
immigrant labor. The other big winners are the immigrants themselves.
Illegal immigration continues to vex the public and policymakers.
Illegal immigrants have clearly benefited by living and working in the
United States. Many business owners and users of immigrant labor have
also benefited by having access to their labor. But some native-born
Americans have also lost, and these losers likely include a
disproportionate number of the poorest Americans.
1. Introduction
One of the most contentious issues in the debate over immigration
policy, both in the United States and abroad, is the question of what
happens to the employment opportunities of native-born workers after
immigrants enter the labor market. Economic theory has straightforward
and intuitive implications about what we should expect: Immigration
should lower the wage of competing workers and increase the wage of
complementary workers, at least in the short run.
For example, an influx of foreign-born laborers reduces the economic
opportunities for laborers — all laborers now face stiffer competition
in the labor market. At the same time, high-skill natives may gain. They
pay less for the services that laborers provide, and natives who hire
these laborers can now specialize in producing the goods and services
that better suit their skills. The theory also suggests that over time,
as the economy adjusts to the immigrant influx, these wage effects will
be attenuated.
Despite the policy importance of this question, economists did not
investigate whether these theoretical predictions were, in fact,
observed in the United States until the early 1980s.
1
The early studies inspired the growth of a vast academic literature
that attempts to detect the presence and measure the size of the
presumed wage effects. The academic literature has gone through several
iterations and adopted several distinct methodological approaches, with
some of the approaches claiming that immigrants have little impact on
the wages of native-born workers, while other approaches conclude that
such an effect exists and may be sizable.
The past decade has witnessed the development of a theory-based
approach to estimating the wage effects, implying that the academic
literature has become increasingly technical (i.e., mathematical) and
even less accessible to non-economists. As an example, instead of
addressing directly the question of whether or not there is a wage
effect, the recent literature has focused on two seemingly tangential
questions: Are immigrants and natives who are equally educated and are
roughly the same age substitutes or complements? Are high school
dropouts and high school graduates interchangeable in the production
process?
To a non-economist, these questions will inevitably seem far removed
from the issue at hand. Moreover, they address narrow topics that sound
like relatively minor theoretical curiosities. Nevertheless, the answer
to the fundamental question underlying the policy debate depends
directly on the nature of these technological relationships. It turns
out that the wage effect of immigration is quite different when
immigrants and natives are complements in production, or when high
school dropouts and high school graduates are interchangeable in
production.
My objective in this essay is to provide an easy-to-follow “English
translation” of the state of academic research on the subject. The essay
describes both what it is we can learn by simply looking at the “raw”
data and emphasizes the increasing importance of unverifiable
assumptions that are often made in the technical literature in order to
interpret the data through a theoretical lens.
2. The Impact of Immigration on the National Labor Market: Descriptive Data
Following a methodological approach introduced in Borjas (2003), many
studies in the past decade estimate the labor market impact of
immigration by examining how the evolution of wages in a narrowly
defined skill group is affected by immigration into that group. The
underlying approach is easy to explain: We can observe long-term wage
trends in the U.S. labor market for specific skill groups (e.g., young
high school graduates or college graduates in their late 40s). We can
then attempt to determine if the wage trends are correlated with the
entry of immigrants into that particular skill group. Presumably, those
skill groups that experienced the largest “supply shocks” would be the
ones where wages either fell the most or grew the least.
This examination of wage trends across skill groups in the national
labor market has much in common with the vast literature that attempts
to identify the factors responsible for the increase in U.S. wage
inequality over the past three decades. Many studies in that literature
document that the size of the workforce that has a set of specific
skills helps to determine the group’s relative wage.
2 In other words, these studies — all done
outside
the immigration context — conclude that changes in the number of
workers belonging to a particular skill group affect the employment
opportunities faced by that group.
As I shall discuss below, prior to the introduction of this approach,
the immigration literature focused mainly on comparing outcomes in
different cities to measure the impact of supply shifts on wages. In
other words, the typical early study would compare labor market
conditions in a city that received many immigrants to those in cities
that received few immigrants, and infer the labor market impact from
this “spatial correlation”.
An important conceptual reason for shifting the unit of analysis away
from a city and toward skill groups in the national labor market is to
avoid the “contamination bias” that results from the fact that natives
have an incentive to respond to supply shocks. If immigration worsens
economic conditions in a particular city, then native workers, for
instance, have an incentive to both move out of that city
and not
to move there. These flows diffuse the impact of immigration into
geographic regions that were not directly affected by the immigrant
influx. By shifting the focus of analysis to skill groups, the
composition of the native workforce in each of the skill groups is
relatively fixed, so that there is less potential for native flows to
contaminate the comparison of outcomes across skill groups. After all,
it is impossible for natives to suddenly become younger or older to
avoid immigrant competition, and it is very costly (and would take some
time) for natives to obtain additional education.
To illustrate the nature of the evidence, I use decennial census data
that summarize conditions in the U.S. labor market between 1960 and
2010. Specifically, I use data drawn from the 1960-2000 decennial
censuses, and the pooled 2007-2011 American Community Surveys (ACS). For
expositional convenience, I refer to the pooled ACS samples as the
“2010 census”. These data sets are quite large. The 1960 and 1970 census
datasets represent a 1 and 3 percent random sample of the population,
respectively. Beginning in 1980, all of the datasets represent a 5
percent random sample of the population.
I use these data to classify workers into skill groups defined by education and work experience.
3
In particular, workers are classified into five distinct education
groups: persons who are high school dropouts (i.e., they have less than
12 years of completed schooling), high school graduates (they have
exactly 12 years of schooling), persons who have some college (they have
between 13 and 15 years of schooling), college graduates (they have
exactly 16 years of schooling), and persons who have post-college
education (they have more than 16 years of schooling).
Since an influx of, say, foreign-born college graduates in their
early 20s is likely to have different labor market effects on young and
old college graduates, I further classify skill groups in terms of the
number of years that have elapsed since the worker completed school. I
capture the similarity across workers with roughly similar years of
experience by aggregating the data into five-year experience intervals,
indicating if the worker has 1 to 5 years of experience, 6 to 10 years,
and so on. There are, therefore, a total of 40 skill groups in the
analysis (i.e., five education groups and eight experience groups).
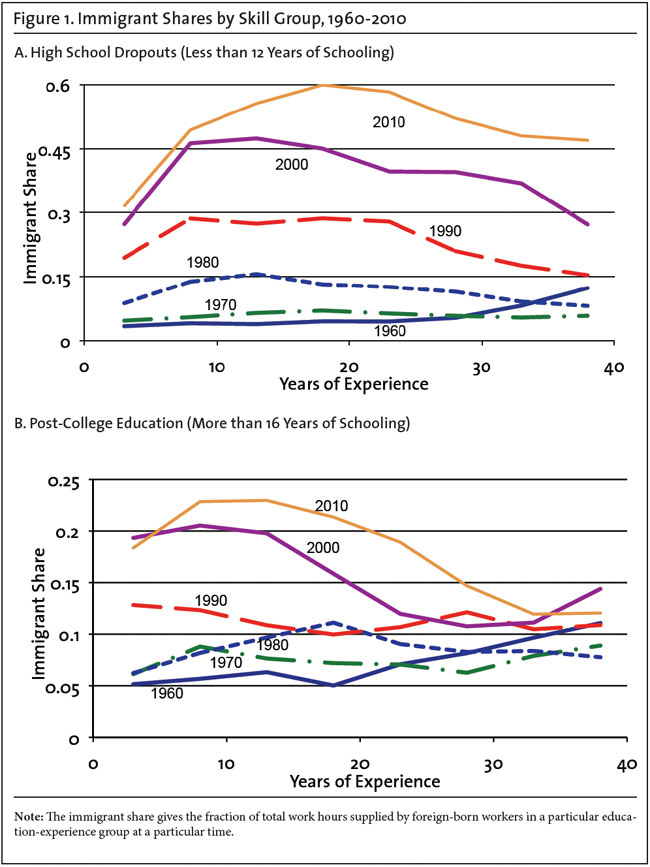
I define the “immigrant share” for each of these skill groups as the
fraction of the workforce in that group that is foreign-born.
4
The immigrant share obviously measures the size of the supply shock
that affects the labor market for a particular skill group at a
particular time. Figure 1 illustrates the supply shocks experienced by
selected skill groups between 1960 and 2010. It is well known that
immigration into the United States greatly increased the supply of high
school dropouts in recent decades. What is less well known is that this
supply shift did not affect all age groups within the population of high
school dropouts equally. Moreover, the nature of the imbalance changed
over time. As Panel A of the figure shows, immigrants made up almost 60
percent of all high school dropouts with around 20 years of experience
in 2010, but only 30 percent of those with less than five years. In
1960, however, the immigration of high school dropouts most increased
the supply of the oldest workers. Similarly, Panel B shows that in 1990
the immigrant supply shift for workers with more than a college
education was reasonably balanced across all experience groups,
generally increasing supply by around 10 percent. By 2010, however, the
supply shift for these highly educated workers was far larger for those
with less than 15 years of experience.
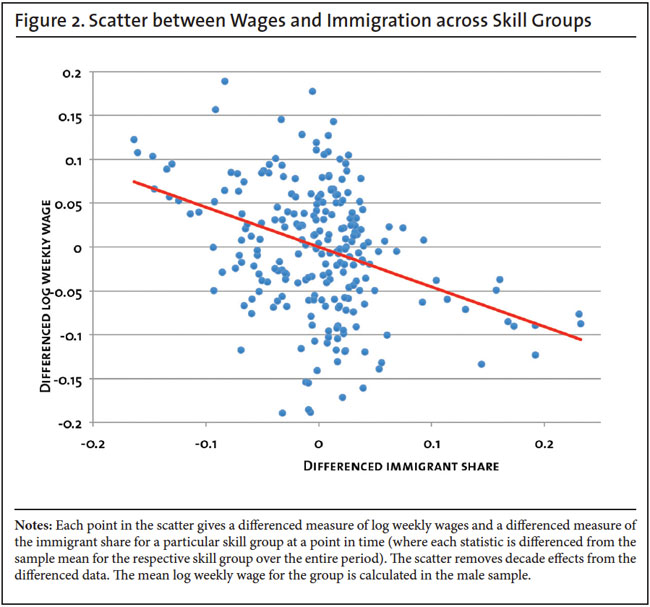
It is easy to demonstrate the strong link that exists between trends
in the wages of native-born workers and the immigrant share within these
schooling-experience groups. In particular, Figure 2 presents the
scatter diagram relating the
change in (log) weekly earnings for each group to the
change in the immigrant share for that group, after removing decade effects from the data.
5
The figure clearly documents a negative relation between the growth in
weekly earnings and immigration. Put simply, the raw data at the
national level show that weekly earnings in any particular decade grew
most for workers in the skill groups least affected by immigration in
that decade.
These data can be used to estimate a multivariate regression model
that relates changes in (log) weekly earnings for a particular group to
the change in the immigrant share for that skill group. It is worth
emphasizing that this statistical framework adjusts for changes in labor
market conditions between 1960 and 2010 that might affect wages
differentially for the various skill groups. In rough terms, the
regression framework generates a trend line similar to the one
illustrated in Figure 2, but one that also controls for the fact that
the returns to skills were changing over the past few decades due to
many other reasons.
6 The slope of this trend line then gives the wage impact of immigration.
Table 1 summarizes the evidence from a number of alternative
specifications of the regression model using the 1960-2010 census data.
The first two columns of the table report the regression coefficients
(and standard errors) for the immigrant share variable. To make the
results easily understandable, the last two columns of the table
transform the coefficients into an implied wage impact. The first row of
the table reports that if immigrants increased the total number of
workers in a skill group by 10 percent, the wage trends observed over
the past 50 years would suggest that the weekly earnings of working men
would fall by 3.7 percent.
7
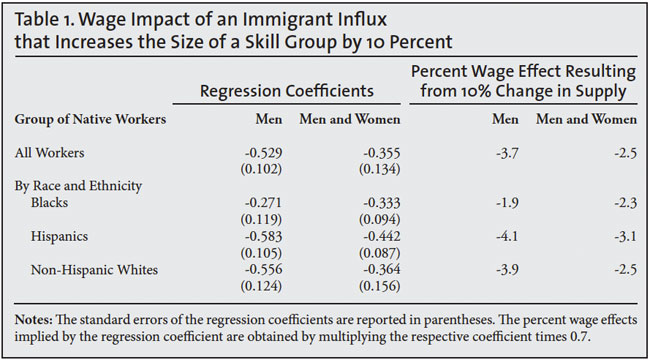
It is also interesting to determine if these adverse wage effects are observed in specific racial or ethnic groups.
8
The remaining rows of Table 1 report the estimated wage effects when
the model is estimated separately in the samples of native-born black,
Hispanic, and non-Hispanic white workers.
9
In all cases, it is evident that the wage of each native group falls
whenever immigration increases. In the case of blacks, for example, a 10
percent increase in the size of the skill group lowers the wage of
blacks in that group by around 2 percent. In the case of native-born
Hispanics, the wage would drop by 3 to 4 percent.
Related International Evidence
The simple methodology underlying the national-level approach has
inspired a number of replications in other countries. One particularly
interesting context is given by the Canadian experience. Since 1967,
Canada has used a “point system” aimed explicitly at selecting
high-skill immigrants. The point system awards points to visa applicants
who have particular socioeconomic characteristics (e.g., more schooling
and fluent English or French language skills), and then sets a passing
grade that determines which applicants qualify for a visa. The first row
of Table 2 reports that a 10 percent immigration-induced increase in
the size of a skill group in Canada lowers the wage of that group by 3.5
percent.

In contrast, Mexico is a major source country for international
migrants, with almost all of the emigrants moving to the United States.
Mishra (2007) merged data from the Mexican and U.S. censuses to
calculate an out-migration rate for each education-experience group and
then estimated a regression model that related the earnings of Mexicans
who stayed in Mexico to the outmigration rate in their skill group. She
found a strong
positive correlation between the earnings of
Mexican stayers and the size of the outflow. A 10 percent reduction in
the size of a skill group in Mexico raises the wage of the Mexicans who
stayed behind by 3.1 percent.
Finally, several studies have replicated the analysis in the European
context. In Germany, for example, the immigrant share increased
significantly in the 1990s. Some of the German studies report a
significant, though weaker, negative correlation between immigration and
the wage growth of specific skill groups in the German labor market,
even though wages are thought to be relatively rigid in Germany. A 10
percent increase in supply lowers the wage of native-born Germans by 1
to 2 percent. Similarly, the fraction of the workforce that is
foreign-born in Norway increased from 2 to 10 percent in the past three
decades. Using administrative data that cover
all workers in
Norway from 1993 through 2006, a recent study found that a 10 percent
increase in the size of the skill group reduced the wage of native-born
Norwegians by 2.7 percent.
In sum, the descriptive national-level data confirm the common-sense
expectation that an immigration-induced increase in the size of a
particular skill group is associated with a decline in the wage of that
skill group, both in the United States and abroad. It is important,
however, to emphasize that although this adverse wage effect is costly
for some (i.e., for the affected workers), it can create benefits as
well. The benefits will be discussed below.
3. A Theory-Based Approach
Although the descriptive approach presented in the previous section
provides an easy-to-understand framework for measuring the labor market
impact of immigration, it does not fully capture how immigration changes
labor market opportunities for the native-born. After all, the entry of
immigrants into one skill group affects not only the wage of that skill
group, but the wage of every other group as well. For example, the
entry of young high school dropouts could influence the wage of young,
high school dropouts
and the wage of young and old college
graduates. The scatter diagram in Figure 2 suggests that the descriptive
approach ignores all of these potentially important “cross-effects”.
The problem with measuring the magnitude of the cross-effects is that
the empirical exercise quickly becomes an intractable problem. The
analysis summarized in the previous section, for example, used 40 skill
groups, composed of five education groups and eight experience groups. A
fully general approach would imply that there are 1,600 (or 40 * 40)
effects to measure if we truly wanted to describe the complete impact of
immigration on the wage structure. After all, immigration into one
group affects that group’s wage, as well as the wage of 39 other groups.
This type of framework would quickly run out of available data, and
would lead to results that had little empirical plausibility.
To measure the cross-effects, therefore, it is crucial to reduce the
dimensionality of the problem. Put differently, any study of these
cross-effects
must narrow the scope of the problem by relying on a model derived from economic theory.
The theory-based approach begins by specifying a “production
function” that delineates how various types of labor and capital
interact in the production process, and then assumes that workers are
paid the value of their contribution to the firm’s revenue (a standard
result in labor markets that are competitive). The assumption of a
specific formula for the production function permits the estimation of
the complete set of effects that determine how immigration alters the
entire wage structure.
One particularly tractable approach has become widely used since its
introduction into the immigration literature by Borjas (2003). That
study assumed that the technology of the labor market could be
represented by a three-level nested CES production function (where “CES”
stands for Constant Elasticity of Substitution).
The wage effects resulting from immigration in this theory-based
approach depend specifically on the extent to which various groups,
including immigrants and natives, are substitutes or complements in the
production process. Since much of the subsequent debate over the wage
impact of immigration has focused on these technological relationships,
it is crucial to understand the nature of the theoretical and empirical
exercise. Figure 3 presents a schematic diagram describing the nature of
the nesting.

Beginning with the bottom level, the three levels in the production technology are given by:
Level 1: The workforce in a particular education group
contains workers who are relatively young (and have little work
experience) and workers who are older (and have much more work
experience). The “effective” labor input provided by this education
group aggregates the contribution made by workers in each of the
different experience groups. However workers in each of these experience
groups may contribute differently to the calculation of the effective
labor input provided by the specific education group. This level
introduces an important variable: the
elasticity of substitution across experience groups.
This elasticity details how easy it is to substitute workers who are
young with workers who are older. The elasticity would be close to 0 if
younger and older workers (within an education group) were not easily
substitutable, and would be very large if they were.
Level 2: The total “effective” labor input in the U.S. labor
market is defined by some aggregation of the contributions made by the
five education groups defined in Level 1 (high school dropouts, high
school graduates, etc.). However, the different education groups
contribute differently to the aggregate labor input. This level
introduces another important variable: the
elasticity of substitution across education groups.
This variable measures how easy it is to substitute workers in one
education group with workers from another group. This elasticity would
again be close to zero if workers in different education groups were not
easily substitutable, and would be very large if the workers were
easily substitutable.
Level 3: The aggregate output of the United States is produced
by combining labor and capital, where labor is measured by the total
number of “effective” labor units contributed by the many different
types of workers who participate in the labor market. This level
introduces a final variable into the framework: the
elasticity of substitution between labor and capital.
This elasticity is close to zero if labor and capital are not easily
substitutable, and is very large if labor and capital are easily
substitutable.
Despite the superficial complexity introduced by thinking about the
labor market in this nested fashion, the framework has three features
that make it extremely useful for measuring the wage impact of
immigration. First, it greatly reduces the dimensionality of the
problem. As noted above, we would need to estimate 1,600 different wage
effects to fully capture how immigration affects the entire wage
structure. The nested framework drastically reduces the dimensionality
of the problem: The technology can be summarized in terms of the
three elasticities of substitution defined above.
Second, the framework is easily estimable using the national-level
census data by education and experience introduced in the descriptive
analysis earlier. Specifically, the data on wages, employment, and
immigration in each of the 40 skill groups can be used to estimate
two
of the three elasticities of substitution: the elasticity of
substitution across education groups and the elasticity of substitution
across experience groups.
Finally, the framework can be easily extended to include other
considerations. For example, there has been a lot of interest in the
possibility that there exists a
fourth level in the nesting.
Specifically, the effective labor input of workers who belong to one of
the 40 skill groups (e.g., high school dropouts in their early 30s) can
be viewed as composed of the contribution of native-born and
foreign-born workers in that skill group. Immigrants and natives in that
skill group need not be “perfect substitutes” so that the entry of
immigrants in that skill group “complements” their native counterparts,
and makes natives more productive. I initially assume that immigrants
and natives within a skill group are interchangeable, but I will return
to a full discussion of this issue in the next section.
Once we know how easy (or hard) it is to substitute workers in
different skill groups, the main “deliverable” from this type of
analysis is a simulation of how a particular level of immigration
affects the wage structure. In other words, once we know the value of
the various elasticities of substitution, it is a simple matter to
“grind through” the model and find out what happens to wages if, say,
immigration increased the supply of the various skill groups by a
certain number.
This type of simulation is often done both in the short run and in
the long run. The short-run wage effects measure the impact of
immigration on the wage structure before the economy has adjusted to it
in any way. Since immigration changes economic opportunities for many
groups, the economy is likely to adjust over time. For example,
employers may wish to expand to take advantage of the lower wages,
increasing their investments in capital. By definition, in the long run,
all adjustments that could have taken place will have taken place. We
do not know if the long run is reached within a year, a decade, a few
decades, or, as Keynes put it, “after we are all dead”. Nevertheless,
the two simulations can be interpreted as giving numerical bounds for
the wage effects of immigration.
It is important to emphasize that there is one variable that has not
been estimated directly by the immigration literature, but is instead
assumed to take on a specific value: the elasticity of substitution
between labor and capital. Because of various methodological
difficulties, the studies in the literature simply make an assumption
about the value of this elasticity.
10
Specifically, they assume that this elasticity takes on a value of 1.0
— or, equivalently, they assume that the production function in the
U.S. economy that combines labor and capital to produce output is given
by what is known as a “Cobb-Douglas production function”.
11 This assumption is not innocuous.
The estimation of the model using the wage and employment data for
each of the 40 education groups in the national labor market between
1960 and 2010 yields estimates of two elasticities of substitution. They
are 6.7 for the elasticity of substitution across experience groups,
and 5.0 for the elasticity of substitution across education groups.
12
To get a rough idea of what these numbers mean: An elasticity that is
close to zero would imply that the groups are “perfect complements”
while an elasticity that is very large (i.e., infinity) would imply that
the groups are “perfect substitutes”.
These elasticities can be used to simulate the wage impact of the
immigrant influx that entered the United States between 1990 and 2010.
Panel A of Table 3 summarizes the results of the simulation. In
particular, the table uses the estimated elasticities of substitution to
calculate the percent wage change resulting from the actual supply
increase. The first row of Table 3 shows that immigration particularly
increased supply at the bottom and top of the education distribution.
Immigration increased the effective number of hours supplied by high
school dropouts by 25.9 percent, and those of workers with more than a
college degree by 15.0 percent. In contrast, immigration increased the
number of hours supplied by workers with 12 to 15 years of school by
only 6 to 8 percent. Overall, immigration increased effective supply by
10.6 percent during the two-decade period.
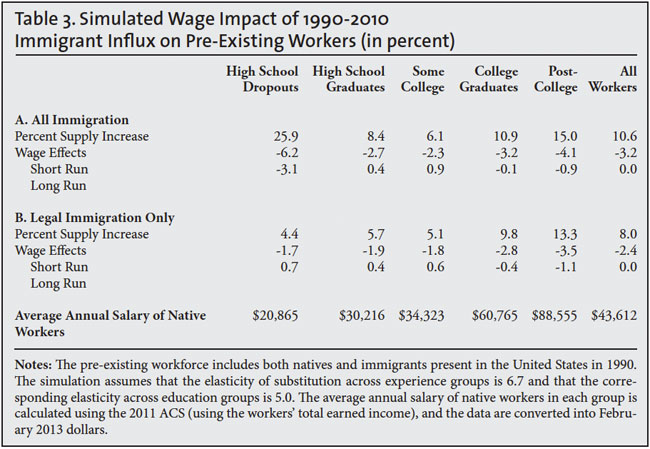
Because of the skewed nature of the supply shift, the simulation
shows that immigration particularly affected the wage of native workers
at the two ends of the education distribution. The large supply increase
experienced by high school dropouts reduced the wage of this group by
6.2 percent in the short run and 3.1 percent in the long run. Similarly,
the wage declines for the most highly skilled workers (those with more
than a college degree) were 4.1 percent in the short run and 0.9 percent
in the long run.
The last row of the table reports the average earnings for each
education group. By multiplying the percent wage effects by average
earnings, it is easy to calculate the dollar loss resulting from the
supply shock: The earnings of native-born high school dropouts are
predicted to fall by some amount between $650 and $1,300, while the
earnings of native-born post-graduates fall by $800 to $3600.
If we take the weighted average of the wage effects across education
groups, we find that the average wage of a pre-existing worker fell by
3.2 percent in the short run and 0.0 percent in the long run. It is
important to emphasize a technical point that has not been sufficiently
appreciated in the immigration debate:
These average wage effects have nothing to do with the underlying data.
As I discuss in the Technical Appendix, they are the mechanical
predictions of the Cobb-Douglas assumption mentioned earlier. This
assumption builds in the fact that the average wage effect in the long
run
must equal 0.0 percent, regardless of the size of the
immigrant influx. Similarly, the assumption builds in the fact that the
average wage effect in the short run
must equal the product of -0.3 and the size of the supply shift (i.e., -3.2 percent equals -0.3 times 10.5).
The mechanical nature of the predicted impact of immigration on the
average
wage level suggests that we should be prudent when interpreting the
wage effects implied by the simulation. The observed data simply help to
“place” the wage effect for each of the education groups around the
mechanically predetermined average wage effect. The Cobb-Douglas
assumption algebraically implies that the average wage effect in the
long run
must have been 0.0 percent. Therefore, some education
groups must have experienced a wage loss that is somewhat larger than
zero, while other education groups must have experienced a somewhat
smaller wage loss.
The mechanical nature of the average wage effect suggests that the
only valuable results that come out of the simulation deal with the
impact of immigration on
relative wages. In other words, immigration led to a 3 percent decline in the wage of high school dropouts
relative
to that of college graduates, and this is true both in the short run
and the long run. Immigration, therefore, is implied to have reduced the
relative earnings of high school dropouts by around $600.
Let me conclude by addressing a point that is often brought up in the
policy debate. Immigration has its largest negative impact on the wage
of native workers who did not graduate from high school, a group that
makes up a modest (and, in recent decades, shrinking) share of the
workforce. However, these workers are among the poorest Americans.
According to the 2012 Current Population Survey, 22.3 percent of all
adults 18-64 who are in poverty (and out of school) are high school
dropouts. Similarly, the children of these workers make up a
disproportionate number of the children in poverty: 24.8 percent of all
children of the native-born working poor live in households headed by a
high school dropout. In short, although native-born high school dropouts
may make up a small fraction of the native-born population, they are
particularly vulnerable to the adverse wage effects of immigration.
The Wage Effects of Illegal Immigration
With a model of the U.S. economy in place, the simulation exercise
can now be adapted to examine the wage impact of immigration under many
different scenarios. In particular, the exercise can be used to get a
sense of the magnitude of the impact of illegal immigration on the U.S.
wage structure.
Between 1990 and 2010, the number of illegal immigrants rose from 3.5
to 11.7 million, while the total number of foreign-born persons rose
from 19.8 to 40.0 million.
13
The labor market data from the various censuses indicate that the
number of foreign-born persons in the workforce rose from 9.3 to 21.4
million over the same period.
14
If we assume that the increase in the number of undocumented workers
in the labor market was proportional to their increase in the
population, the number of undocumented workers rose from 1.6 to 6.3
million. We can then allocate the increased number of undocumented
immigrants to the various education groups using the information
provided in Passel and Cohn (2009) and work through the simulation
exercise assuming that
no illegal immigrants entered the country in those two decades.
15 The bottom panel of Table 3 reports the results of the simulation.
Not surprisingly, the increase in the supply of low-skill workers,
particularly high school dropouts, would have been much smaller had
there been no illegal immigration. In the absence of illegal immigrants,
immigration would only have increased the supply of high school
dropouts by 4.4 percent, as compared to the rise of 25.9 percent that
actually occurred.
The wage effects on the low-skill workforce would also have been much
smaller. The short-run wage effect on high school dropouts would have
been -1.7 percent, as compared to the -6.2 percent implied by the actual
immigrant flows. In fact, in the absence of illegal immigration,
immigration would have had little impact on relative wages, since the
short-run wage effect is between 2 and 3 percent for almost all groups.
Nevertheless, a comparison of the two panels of the table suggests that
illegal immigration was probably responsible for around a 4 percent
decline in the wage of high school dropouts (relative to college
graduates), both in the short and long runs (or around $800).
4. Are Immigrants and Natives Complements?
Up to this point, the analysis has assumed that immigrant and native
workers belonging to a particular skill group (i.e., immigrants and
natives who are equally educated and have the same age) are
interchangeable in production or, more precisely, “perfect substitutes”.
The question of whether there is within-group imperfect substitution —
giving rise to potential complementarities between similarly skilled
immigrants and natives — has been studied extensively in the past
decade, particularly by Ottaviano and Peri (2006, 2012), who report
finding evidence of within-group complementarity. In fact, in the
initial 2006 version of their work, they concluded that the
complementarities were sufficiently strong that an immigration-induced
supply shock would increase the wage of almost all native workers.
As noted earlier, the possible existence of within-group
complementarities can be easily addressed in the nested CES framework by
adding a fourth (bottom) level to the production technology. In
particular:
Level 0: The “effective” labor input contributed by workers in
a particular education/age group is obtained by aggregating the
supplies offered separately by native- and foreign-born workers in that
group. Immigrants and natives in this narrowly defined group may
contribute differently to the total labor input provided by that group.
This level introduces a fourth variable: the
elasticity of substitution between immigrants and natives.
This elasticity would be close to zero if immigrants and natives were
not easily substitutable, and would be very large if they were.
It is important to emphasize that the nature of the complementarity
measured at this fourth level of the nesting is very narrow. It does not
describe how low-skill immigrants and high-skill natives may interact
in the production process — which is the type of complementarity that
many would think to be empirically relevant in the context of the U.S.
labor market. Instead, it describes the potential complementarities that
may arise when a 30-year old foreign-born high school dropout interacts
with a 30-year old native-born high school dropout. In contrast to the
complementarities between high- and low-skill workers, it is far from
obvious how within-group complementarities would arise; let alone
whether they might be numerically important.
There has been a debate in the academic literature as to the value of
the elasticity of substitution between equally skilled immigrants and
natives. Table 4 summarizes the intellectual history. The first row of
Table 4 reports the value of the elasticity of substitution between
immigrants and natives estimated in Ottaviano and Peri’s (2006) original
study, which was an elasticity of 5.6. As I will show below, this value
of the elasticity, if correct, is indeed sufficiently close to zero to
reverse the finding that many pre-existing native workers were adversely
affected by immigration.
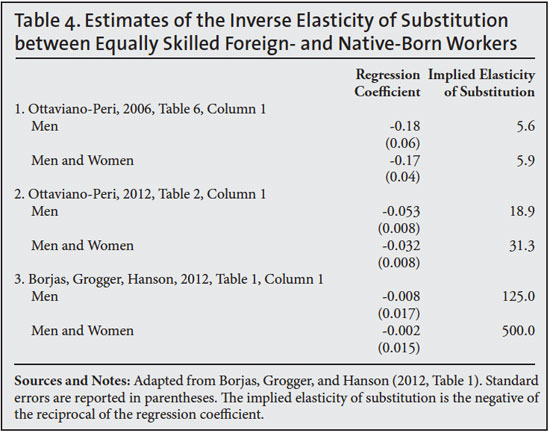
The second row of the table, however, shows that addressing and
correcting a number of data issues in the original study led to a
sizable upward revision in the value of the elasticity of substitution.
Specifically, Borjas, Grogger, and Hanson (2008) documented that the
estimated value of 5.6 was directly attributable to a strange feature of
the data used in the original Ottaviano-Peri study. In particular,
Ottaviano and Peri used a sample of workers aged 17-65, but did
not
exclude persons who were enrolled in school. As a result, millions of
native-born high school juniors and seniors were mistakenly classified
as “high school dropouts”, since they did not yet have a high school
diploma. In the published version of their study, after correcting for
some of these issues, Ottaviano and Peri (2012) report that the value of
the elasticity is around 20, which implies far less complementarity
between equally skilled immigrants and natives. In fact, if the
published version of the elasticity were correct, the inference would
have to be “that there is a
very modest degree of imperfect substitutability” between immigrants and natives (Lewis, 2012, p. 4, italics added).
It turns out, however, that even an elasticity of 20 exaggerates the
immigrant-native complementarity that is actually found in the census
data. In a paper published alongside the Ottaviano-Peri study, Borjas,
Grogger, and Hanson (2012) replicated the Ottaviano-Peri analysis and
found that the estimate of the elasticity would have been even larger if
Ottaviano and Peri had used operational assumptions that are widely
accepted in the labor economics literature.
16
The third row of Table 4 reports the estimated elasticity resulting
from the use of the standard assumptions and the estimate increases to
125, a number that is statistically equivalent to the hypothesis that
immigrants and natives are perfect substitutes. In sum, the evidence
suggests that within-group complementarities between foreign- and
native-born workers are not an important factor in an assessment of the
labor market impact of immigration in the United States.
Table 5 summarizes the importance of the assumed value of the
elasticity of substitution between equally skilled immigrants and
natives in simulations of the wage impact of immigration. To illustrate,
I use three alternative values of the elasticity: 5.6, 20, and
infinity. The elasticity of 5.6 was the value reported in the original
Ottaviano-Peri (2006) study; an elasticity of 20 is the estimate in the
Ottaviano-Peri (2012) published article; and an elasticity of infinity
(or perfect substitution) is what is actually revealed by the census
data.
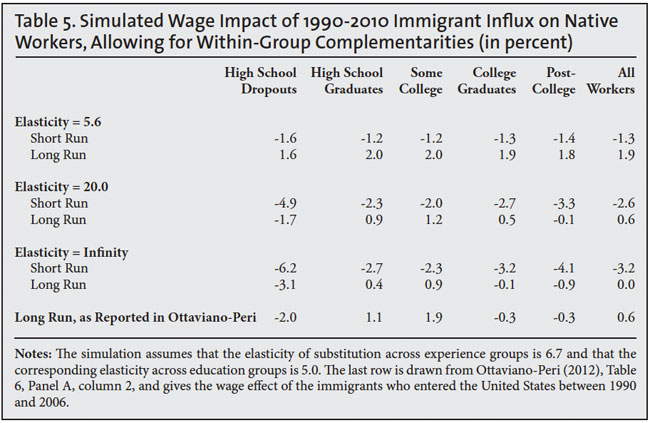
The simulation indeed shows that all native groups would benefit from immigration in the long run
if
there were strong complementarities between equally skilled immigrants
and natives. Note, however, that the “corrected” estimate of the
elasticity (which brought its value up to 20) is, for most purposes,
operationally equivalent to the assumption that the two groups are
perfect substitutes. The short-run wage decline experienced by native
high school dropouts is -4.9 percent when the elasticity is 20 as
compared to -6.2 percent when the two groups are perfect substitutes.
In fact, as the last row of the table shows, the
published
simulation results in the Ottaviano-Peri (2012) study indicate that,
even in the long run, immigration lowered the wage of high school
dropouts by 2.0 percent. In other words, the “official” Ottaviano-Peri
simulation implies that the wage of low-skill native-born workers fell
by 2.0 percent (in the long run) and around 5.0 percent (in the short
run) — even after accounting for potential complementarities between
equally skilled immigrants and natives.
17
5. Are High School Dropouts and High School Graduates Interchangeable?
As I noted earlier, the aggregation of workers into a manageable
number of skill groups is a crucial step in any empirical analysis of
the impact of immigration on the wage structure. In the United States,
immigration has disproportionately increased the size of specific
education groups, such as high school dropouts and workers with
post-college degrees. Not surprisingly, the economics literature has
focused on estimating the impact of immigration on those particular
groups.
It is inevitable, however, that different definitions of the
education groups can lead to very different conclusions about the wage
impact of immigration. It is easy to see why. As reported in Table 3,
the immigrants that entered the United States between 1990 and 2010
increased the number of high school dropouts by 25.9 percent and that of
high school graduates by only 8.4 percent. These dramatic differences
in the size of the supply shift necessarily imply that the wage of high
school dropouts suffered a much greater shock than the wage of high
school graduates.
Suppose, however, that the low-skill workforce is composed of high
school dropouts and high school graduates, and that these two groups are
interchangeable or “perfect substitutes”. The percent increase in the
number of low-skill workers due to immigration would then be numerically
small. After all, the large number of immigrants who are high school
dropouts would be swamped by the far greater number of natives who are
high school graduates. In percentage terms, therefore, immigration would
not have generated a sizable increase in the size of the low-skill
workforce, and the estimated wage impact would be correspondingly
smaller.
There are, in fact, precedents for pooling high school dropouts and
high school graduates in economics. Much of the literature that examines
the increase in wage inequality in the United States over the past
three decades has found it convenient to discuss trends in the returns
to skills by examining the wage gap between two broadly defined
education classifications, “high school equivalents” (defined as an
aggregation of high school dropouts and high school graduates), and
“college equivalents” (defined as an aggregation of workers who have
more than a high school diploma).
Beginning with Card (2009), some studies argue that the high school
equivalents-college equivalents classification should be adopted in the
immigration literature.
18 This argument adds a
fifth
level to the nesting, one that describes how high school dropouts and
high school graduates interact in the production process. The key
variable in this level of the nesting would be the elasticity of
substitution between high school dropouts and high school graduates.
This elasticity would be close to zero if the two groups were not easily
substitutable, and would be very large if the workers were easily
substitutable.
Operationally, the elasticity of substitution between high school
dropouts and high school graduates is estimated by correlating the
percent wage gap between the two groups with the (log) ratio of the
quantities in the two groups. In the national labor market, we would
observe the wage gap and the quantity ratio once per year, so that there
are only a few observations if we were to use decennial census data. As
a result, most studies use the annual Current Population Surveys (CPS)
data, which exists since 1964, to estimate these types of elasticities.
The numerical exercise, however, quickly runs into a major obstacle.
The sign and magnitude of any correlation between the wage gap and the
quantity ratio of the two low-skill education groups is going to be
contaminated by the changes in the demand for different types of
low-skill workers witnessed in the U.S. labor market over the past few
decades. The calculation of the correlation, therefore, must find a way
of controlling for these unobserved demand shifts.
It is typical to address this problem by controlling for some sort of
trend in the regression model. Goldin and Katz (2008), for example,
introduce a linear trend with a “spline” (i.e., a break) after 1992 to
estimate the elasticity of substitution between high school dropouts and
high school graduates. Table 6 illustrates the sensitivity of the
measured elasticity to alternative assumptions about the unobserved
trend in relative demand. The first row reports the estimated elasticity
using the Goldin-Katz CPS data from the 1963-2005 period and their
preferred trend specification.
19
The estimate of the elasticity is 7.4, and rejects the hypothesis that
high school dropouts and high school graduates are perfect substitutes.

The other rows reported in the table use alternative trend
assumptions. It is obvious that the estimated elasticity is sensitive to
the shape of the trend. Row 2, for example, uses a quadratic trend, and
the estimated elasticity has the wrong sign (i.e., the elasticity
should be a positive number), so that the entire theoretical framework
falls apart. Row 3 uses a cubic trend, and the elasticity takes on a
value of 21.3.
Card (2009) introduced an approach that would seem to avoid some of
the pitfalls inherent in making assumptions about the underlying trends
in demand. He correlated the wage gap and quantity ratio of high school
dropouts and high school graduates across cities in the United States.
As row 4 of the table shows, this cross-city correlation does indeed
lead to the conclusion that the two groups are near-perfect substitutes,
with an elasticity equal to 41.7. However, row 5 shows that if the
model were estimated across states (rather than across cities) and
allowed for state-specific trends in relative demand for low-skill
workers, the estimated elasticity would fall to 6.6, suggesting little
substitutability between the two groups.
Table 6 teaches us a very important lesson: The available evidence on
the elasticity of substitution between high school dropouts and high
school graduates is
extremely sensitive to the assumption made
about the trend in the relative demand for the two groups. Different
assumptions yield very different conclusions. In fact, the sensitivity
of the results suggests that the nested CES framework may not be a
particularly useful method for analyzing the substitutability of labor
between these two skill groups.
It is useful to report the findings of one final simulation exercise
to get a sense of the importance of the assumed value of the elasticity
of substitution between high school dropouts and high school graduates
in predicting the wage impact of immigration. Table 7 presents the
results of the simulation using two alternative values for the
elasticity: 7.4 (the value implied by the Goldin-Katz CPS data in row 1
of Table 6); and infinity (the value reflecting the presumption that the
two groups are perfect substitutes). The simulation assumes, as shown
earlier, that immigrants and natives within narrowly defined skill
groups are perfect substitutes.
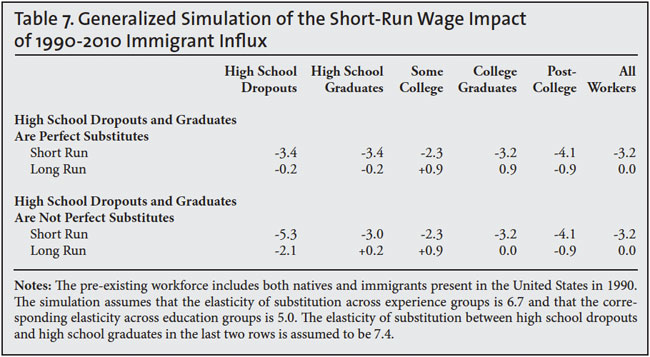
Not surprisingly, immigration has a much weaker impact on the wage of
low skill workers when high school dropouts and high school graduates
are perfect substitutes. For example, the short-run wage impact on high
school dropouts is -3.4 percent if the two groups are perfect
substitutes, but -5.3 percent if the elasticity is around 7. The source
of the weaker impact in the case of perfect substitution is obvious. As
noted above, because immigration disproportionately increased the number
of high school dropouts in the United States, the identification of
high school dropouts as a unique skill group implies that this group
experienced a very large supply shock. By pooling high school dropouts
and high school graduates into “high school equivalents”, the magnitude
of the percent supply increase in the low-skill workforce becomes much
smaller, and the relative wage impact on low-skill workers gets diluted.
Let me conclude the discussion of the theory-based methods of
estimating the wage impact of immigration by noting an incongruity in
the two hypotheses that circulated in the past decade that lead to a
weaker wage impact of immigration. In particular, it has been argued
that: (a) equally-skilled immigrants and natives are complements; and/or
(b) high school dropouts and high school graduates are perfect
substitutes. Although this particular combination of assumptions may,
from some perspectives, give the “right” answer, the cognitive
dissonance inherent in the argument is often overlooked. It requires a
belief that somehow workers who most observers view as different (high
school dropouts and high school graduates) are, in fact, identical;
while workers who most observers would view comparably (similarly aged
and educated foreign- and native-born workers) are, in fact, different.
Although algebraically possible, it seems like a peculiar mix of
technological assertions.
6. An Alternative Way of Measuring the Impact: Looking Across Cities
Although the theory-based approach discussed above seems to have
become a preferred way of measuring the wage impact of immigration in
the past decade, there exists an alternative literature in economics
that is much more descriptive and that focuses entirely on comparing
economic conditions across cities. It seems sensible to presume that we
should be able to measure the wage impact of immigration by comparing
how wages evolve in cities that are affected differentially by
immigration. The wages of substitutable workers, for instance, should
decline more in those metropolitan areas that received a larger
immigrant influx. Although there is a great deal of dispersion in
results across the hundreds of studies in the academic literature, the
cross-city studies generally find that immigration has only a weak
effect on wages.
It is widely recognized, however, that the cross-city estimates
suffer from two potentially serious flaws. First, immigrants may not be
randomly distributed across metropolitan areas. If the areas where
immigrants cluster have done well over some time periods, this would
create a positive spurious correlation. A positive correlation between
wages and immigration may simply indicate that immigrants choose to
reside in areas that are doing relatively well, and the spurious
correlation could easily swamp the presumed negative effect of
immigration on the wage of competing workers.
A second difficulty is that natives may respond to the entry of
immigrants in a particular locality by moving their labor or capital to
other places until native wages and returns to capital are again
equalized across regions. A comparison of the wage of native workers
across cities or states might show little or no difference because the
internal flows have diffused the effects of immigration throughout the
national economy.
There is a classic study in the literature, however, that is
unaffected by these flaws and that also concludes that immigration had
little effect on the employment opportunities of native workers. I am
referring, of course, to Card’s (1990) study of the impact of the Mariel
influx on Miami’s labor market. On April 20, 1980, Fidel Castro
declared that Cuban nationals wishing to move to the United States could
leave freely from the port of Mariel. By September 1980, about 125,000
Cubans, mostly unskilled workers, accepted Castro’s offer and Miami’s
labor force grew by 7 percent.
Card (1990) used a very simple methodology to determine if this
“natural experiment” affected labor market opportunities for Miami’s
pre-existing workforce. Table 8 summarizes some of the evidence by
looking at the unemployment rate of black workers in Miami before and
after the Mariel influx. In 1979, prior to the Mariel flow, the black
unemployment rate in Miami was 8.3 percent. This unemployment rate rose
to 9.6 percent by 1981, after the Mariel flow.
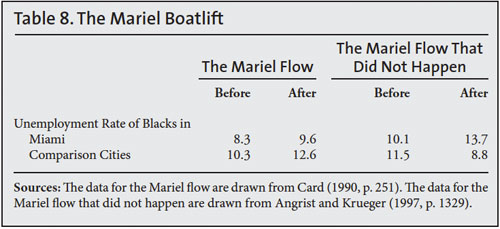
Of course, this fact by itself does not imply anything about the
labor market impact of immigration. In order to isolate this impact, we
need to compare what happened in Miami with what happened in a “control
group”, a set of cities that were untouched by the Mariel influx. As the
table shows, black unemployment was rising even faster in the other
cities that form the control group (as the aggregate economy was
entering a recession), from 10.3 to 12.6 percent. If anything,
therefore, it seems that the Mariel flow actually attenuated the rise in
black unemployment in Miami.
Given the short-run nature of the empirical exercise (the changes in
Miami’s labor market over a two-year period), it would be difficult to
argue that the Mariel study captures the long-run attenuation of
whatever short-run effect might have occurred. Subsequent research,
however, raises questions about whether the Mariel data justifies
any
inference about the impact of immigration. In 1994, economic and
political conditions in Cuba were ripe for the onset of a new refugee
influx into the Miami area, and thousands of Cubans began the journey.
To prevent a “new” Mariel from occurring, however, the Clinton
administration ordered the Navy to redirect all the refugees toward the
American military base in Guantanamo. As a result, few of the potential
migrants reached Miami.
Angrist and Krueger (1999) replicated the methodological design of
the Mariel study by comparing Miami’s labor market conditions — relative
to those in the same control group —before and after “the Mariel
boatlift that didn’t happen”.
20 This non-event had a remarkable
adverse
impact on the unemployment rate of Miami’s black workforce. Table 8
shows that the black unemployment rate in Miami rose from 10.1 to 13.7
percent between 1993 and 1995, as compared to a drop from 11.5 to 8.8
percent in the control group.
Interpreted in the usual way, the evidence would suggest that a
phantom immigrant influx greatly harmed the economic opportunities of
black workers. This nonsensical inference obviously raises questions
about whether one should interpret the evidence for the Mariel boatlift
that
did happen as indicating that immigration had little impact on Miami’s labor market.
The conflicting evidence is probably best interpreted as indicating
that local labor markets are continually affected by many shocks, and it
is impossible to draw specific conclusions about the wage impact of
immigration unless we have a much better understanding of the many other
factors that are shifting supply and demand in these labor markets at a
particular point in time. Put simply, cross-city comparisons do not
seem to measure the labor market impact resulting from an
immigration-induced supply shift.
7. The Benefits from Immigration
The debate over the measurement of the wage effects of immigration is
often motivated by the intrinsic interest in determining how immigrants
alter labor market opportunities for native workers. There exists,
however, another equally important reason for measuring the wage
effects: the
gains to the U.S. economy directly depend on the impact of immigration on native wages.
Natives benefit from immigration in many ways. For example,
immigrants buy goods and services produced by American firms, increasing
the demand for native workers; they can lower the price of services in
many industries, such as construction, benefiting American consumers;
and immigrant entrepreneurs open up firms, create jobs, and possibly
make a large contribution to economic growth.
To measure the economic gains from immigration, we would need to list
all the possible channels through which immigrants transform the
economy. We could then use this exhaustive list to estimate what the
gross domestic product (GDP) of the United States would have been if the
country had not admitted any immigrants. The difference between the
counterfactual GDP and actual GDP yields the increase in national wealth
attributable to immigration. The calculation could also be used to
determine how much of the increase in GDP accrues to natives as opposed
to being paid directly to immigrants in return for their services.
Obviously, this computation is an extremely difficult, if not
impossible, task. As a result, we can only estimate the economic
benefits from immigration if we have a model of the economy detailing
how the various sectors operate and are linked together. One could then
simulate the model to figure out what happens when the labor market is
flooded by millions of new workers.
Existing estimates of the economic benefits from immigration often
use the simplest “textbook model” of a free-market economy to calculate
the benefits. In this framework, wages and employment are set by the
interplay between the supply of and the demand for workers. When wages
are high, many persons want to work, but few firms are looking to hire.
When wages are low, few persons want to work, but many firms are
competing for their services. The labor market balances out the
conflicting interests of workers and firms, and sets employment and
wages so that persons who want to work at the going wage can find jobs.
So what happens in this idealized model when immigrants enter the
labor market? And, equally important, what happens to the income that
accrues to the
native population?
Suppose that all workers, whether immigrants or natives, are equally
skilled. Because immigrants increase the size of the workforce, there is
additional competition in the labor market and the wage of native
workers falls. At the same time, native-owned firms gain because they
can now hire workers at lower wages, and many native consumers gain
because the lower labor costs lead to cheaper goods and services. The
difference between what the winners win and what the losers lose is
called the
immigration surplus, and it gives the gain in national income
accruing to natives as a result of immigration.
The textbook model of a competitive labor market implies a very
simple (and widely used) formula for calculating the immigration surplus
as a fraction of GDP:
21
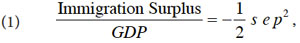
where:
s is labor’s share of GDP, which is around 0.7 in the United States;
e is the “wage elasticity”, measuring the percent change in the
wage resulting from a 1 percent increase in the size of the workforce;
p is the fraction of the workforce that is foreign-born, which is around 0.15.
The formula for the immigration surplus in a competitive labor market
is so simple that practically anyone can conduct a back-of-the-envelope
calculation of the gains, and “play around” with the numbers to get a
good sense of the range of the estimates. Suppose, for example, that the
wage elasticity is -0.3, which implies that a 10 percent increase in
the number of workers lowers wages by 3 percent. The immigration surplus
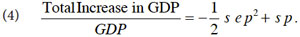
would then be around 0.24 percent of GDP (which equals 0.5 * 0.7 0.3 *
0.15 * 0.15). In 2013, GDP is around $15 trillion. As Table 9 shows,
the formula for the immigration surplus implies that immigration
increases the income accruing to the native-born by around $35 billion
annually.
Needless to say, this estimate of the immigration surplus depends on
the many assumptions that underlie the model. Nevertheless, the model
says something that is useful and surprising: It is mathematically
impossible to manipulate the textbook model of a competitive labor
market so as to yield a huge number for the immigration surplus in a
country like the United States, even after immigration has increased the
size of the workforce by 15 percent.
The formula for the immigration surplus contains another important
insight: The gains from immigration are intimately linked to the wage
loss suffered by workers. Ironically, the United States gains more from
immigration the greater the drop in the wage of workers who compete with
immigrant labor. This implication is analogous to the result from
international trade theory that cheap foreign imports, typically seen as
having harmful and disruptive effects on workers in the affected
industries, often benefit the importing country.
Finally, the formula reveals that the immigration surplus is a
positive number as long as immigration causes some wage depression. In
other words, the United States, on net, benefits from immigration. It is
important to note, however, that immigration has other economic
effects, such as the fiscal impact through expenditures in the welfare
state, but these considerations are separate from the calculation of the
immigration surplus. The immigration surplus focuses solely on what
happens to native income as a result of the changes that occur in the
labor market.
Of course, the losses suffered by native workers do not disappear
into thin air. Immigration redistributes income from workers to those
economic agents who use immigrants (including, of course, firms as well
as households that purchase immigrant services). The textbook model
generates two additional formulas that quantify the magnitude of this
redistribution:


If the wage elasticity is -0.3, native-born workers lose about 2.7
percent of GDP (which is given by 0.7 * -0.3 * 0.15 * 0.85). At the same
time, native-owned firms gain about 2.9 percent of GDP (which equals
0.7 * 0.3 * 0.15 * 0.925). Since GDP is around $15 trillion, workers
lose $402 billion while firms gain $437 billion.
The small immigration surplus of $35 billion, therefore, masks a
sizable redistribution from workers to the users of immigrant labor. Let
me restate this point in a different way: If one wishes to believe that
the immigration surplus in the United States is around $35 billion, it
follows
from the same calculation that the redistribution of wealth from workers to firms is around $400 billion.
I should also add that the exercise is a short-run simulation,
calculating the gains and losses before the economy adjusts in any way
to the immigrant influx. The increased profitability of firms will
encourage capital flows and the economy will expand until the “excess
profits” disappears. As we saw earlier, under standard assumptions in
the immigration literature, the supply shift will not have an impact on
the average wage in the long run. Hence the model implies that
immigration does not alter the price of labor or the returns to capital
in the long run, and natives neither gain nor lose from immigration. In
the long run, therefore, the immigration surplus must be zero.
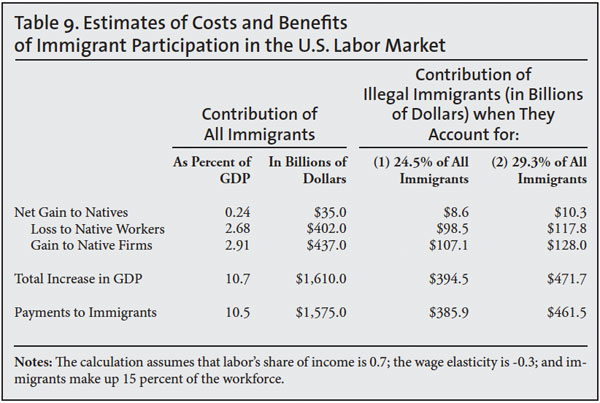
It is also important to emphasize that the immigration surplus gives the increase in national income accruing to the
native
population. The immigration surplus differs from the actual increase
observed in GDP because immigrants receive part of the increase in
national income in return for their (labor) services. It is useful to
write down one last formula implied by the model, the formula that gives
the percent increase in (total) national income:
Assuming again that the wage elasticity is -0.3 and that immigration
increases the size of the workforce by 15 percent, the formula implies
that GDP increased by around 10.7 percentage points, equivalent to a
$1.61 trillion increase. Not surprisingly, a 15 percent increase in the
number of workers leads to a substantial increase in the size of the
aggregate economy. Note, however, that the immigrants themselves receive
the bulk of this increase: The immigration surplus accruing to natives
is only 2.2 percent of the total increase in GDP resulting from
immigration.
22 The calculation identifies a group that benefits substantially from immigration: the immigrants themselves.
23
This “accounting” framework, of course, can be used to calculate the
costs and benefits attributable to ilegal immigration specifically. For
example, how much of the $35 billion net gain is due to the presence of
illegal immigrants in the labor market? To answer this question, we need
to know what fraction of the “effective” labor supply provided by
foreign-born workers is attributable to undocumented workers.
Although we do not have precise estimates of this fraction, it can be
roughly approximated. For example, about 29.3 percent of the current
foreign-born population is illegal (or 11.7 million out of 40 million
foreign-born persons). It is likely, however, that illegal immigration,
which is predominantly low-skill, makes a smaller contribution to
effective labor supply than their share of the foreign-born population.
In fact, the simulation exercise in Table 3 suggests that ilegal
immigration accounts for 24.5 percent of the effective workforce.
24 These two estimates thus provide a bound for calculating the benefits and costs attributable to illegal immigration.
The last two columns of Table 9 summarize the calculation. Illegal
immigration accounts for less than a third, or around $10 billion, of
the immigration surplus accruing to natives. Similarly, their
contribution to overall GDP is substantial, increasing national income
by between $395 and $472 billion, but much of this increase (between
$386 and $462 billion) is remitted to the illegal immigrants themselves
as payment for their services.
25
Technical Appendix
As I noted in the text, the theory-based simulations that are
typically reported in the academic literature (and updated in this
report) use the assumption that the aggregate production function in the
United States has a Cobb-Douglas functional form. The assumption builds
in the following algebraic rule into
every single simulation:
In the short run, the percent change in the average wage
resulting from a 1 percent increase in the number of workers must equal
the negative of capital’s share of income.
It is well known that around 70 percent of GDP in the United States
is distributed to workers, so that capital’s share of income is 0.3.
Therefore, a 1 percent increase in supply must lead to a -0.3 percent
decline in the average wage in the short run. Equivalently, a 10 percent
increase in supply must reduce the average wage by 3 percent. It is
worth emphasizing that this prediction is implied by the algebra of the
model and has nothing whatsoever to do with the underlying data.
Furthermore, the same algebra implies that the average wage
cannot be affected by immigration in the long run. Hence a second rule:
In the long run, the percent change in the average wage
resulting from a 1 percent increase in the number of workers must equal
0.0 percent.
As I emphasized in the text, the assumption that the aggregate production function in the United States is Cobb-Douglas is
not
innocuous. Nevertheless, it is an assumption that has been adopted in
the theory-based literature that blossomed in the past decade. It is
important to keep this fact in mind when interpreting the simulation
results that are commonly presented in the academic literature.
References
Angrist, Joshua D., and Alan B. Krueger. 1999. Empirical strategies
in labor economics. In: Orley Ashenfelter and David Card, eds.,
Handbook of labor economics, volume 3, 1277-1366. Amsterdam: Elsevier.
Autor, David H., Lawrence F. Katz, and Melissa S. Kearney, Trends in U.S. wage inequality: Revisiting the revisionists.
Review of Economics and Statistics 90: 300-323.
Aydemir, Abdurrahman and George J. Borjas. 2007. Cross-country
variation in the impact of international migration: Canada, Mexico, and
the United States.
Journal of the European Economic Association 5: 663-708.
Bonin, Holger. 2005. Wage and employment effects of immigration to
Germany: Evidence from a skill group approach. IZA Discussion Paper no.
1875.
Borjas, George J. 2003. The labor demand curve
is downward sloping: Reexamining the impact of immigration on the labor market.
Quarterly Journal of Economics 118: 1335-1374.
Borjas, George J., Jeffrey Grogger, and Gordon H. Hanson. 2008.
Imperfect substitution between immigrants and natives: A reappraisal.
NBER Working Paper no. 13887.
Borjas, George J., Jeffrey Grogger, and Gordon H. Hanson. 2010. Immigration and the economic status of black men.
Economica 77: 255-282.
Borjas, George J., Jeffrey Grogger, and Gordon H. Hanson. 2012. On estimating elasticities of substitution.
Journal of the European Economic Association 10: 198-210.
Bratsberg, Bernt, Oddbjørn Raaum, Marianne Røed and Pål Schøne. 2013. Immigration wage impacts by origin.
Scandinavian Journal of Economics, forthcoming,
Card, David. 1990. The impact of the Mariel boatlift on the Miami labor market.
Industrial and Labor Relations Review 43: 245-257.
Card, David. 2009. Immigration and inequality.
American Economic Review 99: 1-21.
Card, David, and Thomas Lemieux. 2001. Can falling supply explain the
rising return to college for younger men? A cohort-based analysis.
Quarterly Journal of Economics 116: 705- 746.
Goldin, Claudia and Lawrence F. Katz. 2010.
The race between education and technology. Cambridge, MA: Harvard University Press.
Grossman, Jean Baldwin. 1982. The substitutability of natives and immigrants in production.
Review of Economics and Statistics 54: 596-603.
Johnson, George E. 1998. Estimation of the impact of immigration on
the distribution of income among minorities and others. In: Daniel S.
Hamermesh and Frank D. Bean, eds.,
Help or hindrance? The economic implications of immigration for African-Americans, 17-50. New York: Russell Sage.
Katz, Lawrence F. and Kevin M. Murphy. 1992. Changes in the wage structure, 1963-87: Supply and demand factors.
Quarterly Journal of Economics 107: 35-78.
Lewis, Ethan. 2012. Immigration and production technology. NBER Working Paper no. 18310.
Mishra, Prachi. 2007. Emigration and wages in source countries: Evidence from Mexico.
Journal of Development Economics 82: 180-199.
Murphy, Kevin M., and Finis Welch. 1992. The structure of wages.
Quarterly Journal of Economics 107: 215-326.
Passel, Jeffrey and D’Vera Cohn. 2009.
A Portrait of Unauthorized Immigrants in the United States. Washington, DC: Pew Hispanic Center Report.
Ottaviano, Gianmarco I. P., and Giovanni Peri. 2006. Rethinking the
effect of immigration on wages. NBER Working Paper no. 12497 (original
draft).
Ottaviano, Gianmarco I. P., and Giovanni Peri. 2012. Rethinking the effect of immigration on wages.
Journal of the European Economic Association 10: 152-197.
Steinhardt, Max Friedrich. 2009. The wage impact of immigration in
Germany: New evidence for skill groups and occupations. HWWI Research
Paper no. 1-23.
U.S. Bureau of Labor Statistics. 2012. Employer Costs for Employee Compensation – September 2012. Washington, DC.
Warren, Robert and John Robert Warren. 2013. Unauthorized Immigration
to the United States: Annual Estimates and Components of Change, by
State, 1990 to 2010.
International Migration Review, forthcoming.
End Notes
1 Grossman (1982) is the first study that directly addresses the empirical question.
2 See Murphy and Welch (1992), Katz and Murphy (1992), and Card and Lemieux (2001).
3 The analysis is restricted to persons aged 18-64, who do not reside in group quarters, and are not enrolled in school.
4 The calculation of the immigrant
share uses data on total hours worked by immigrants and natives (rather
than a simple body count), so it can be interpreted as the fraction of
all work hours that is supplied by foreign-born workers.
5 More precisely, the points in the
scatter diagram are the residuals from a regression of the group’s log
weekly earnings and the immigrant share on a set of education-experience
fixed effects and on decade fixed effects. The education-experience
fixed effects ensure that each data point represents deviations from the
mean observed for that group over the entire period while the decade
fixed effects remove any decade-specific wage effects that are common to
all groups. To better measure the price of a skill unit, the empirical
exercise uses the mean log weekly wage of workers in the wage and salary
sector.
6
 7
7 In the sample of working men, the
regression coefficient is -0.529. The implied wage effect is given by
the product of this coefficient and (1 –
p)
2, where
p
is the immigrant share. Since the immigrant share in the U.S. labor
force is around 15 percent, the multiplicative factor is around 0.7. See
Borjas (2003) for details.
8 Although the discussion focuses on
wage effects, immigration also has employment effects. Using a similar
framework, Borjas, Grogger, and Hanson (2010) report that a 10 percent
increase in supply lowers the employment rate of black men by 5.1
percentage points and that of white men by 1.6 percentage points.
9 Borjas, Grogger, and Hanson (2010)
present an extensive analysis of the impact of immigration on the
employment and earnings of the African-American population.
10 To estimate this parameter would
require additional data specifying the nature of changes in the capital
stock. Although it is possible to estimate the parameter using only wage
and employment data, this methodology would not be robust since
aggregate conditions in the labor market are only observed a total of
six times (once in each census).
11 The Cobb-Douglas production function is given by ,

where
Q is output,
K is the capital stock, and
L
is the labor input. If the labor market were competitive, the parameter
α is the fraction of GDP that is distributed to firms (or around 0.3 in
the United States).
12 The regression coefficient
estimating the reciprocal of the elasticity of substitution across
experience groups was 0.15 (with a standard error of 0.03). The
regression coefficient estimating the reciprocal of the elasticity of
substitution across education groups was 0.20 (with a standard error of
0.08). As suggested by the work of Autor, Katz, and Kearney (2004), the
regression that estimates the elasticity of substitution across
education groups allows for a post-1992 “spline” by including
interactions between the education fixed effects and a linear trend, and
interactions between the education fixed effects and an indicator that
“turns on” after 1990.
13 Warren and Warren (2013).
14 More precisely, this is the number
of total work hours supplied by the foreign-born population divided by
2000, so it is the number of foreign-born “full-time equivalents.”
15 Passel and Cohn (2009, p. 11)
report that 47 percent of undocumented immigrants have less than a high
school education, 27 percent have a high school diploma, 10 percent have
some college, and 16 percent are college graduates or more. For each
education group, the simulation assumes that undocumented immigration
increased the supply of workers for all age groups by the same
proportion.
16 Specifically, Borjas, Grogger and
Hanson (2012) examine how cell-specific wages were calculated in the
Ottaviano-Peri study. The latter used an extremely unusual definition:
the log of mean earnings for a particular cell. The standard approach in
the literature (which is consistent with the underlying theory) is to
use the mean of log earnings. Borjas, Grogger, and Hanson also address
the issue of how the observations are weighted in the regressions
estimated in the Ottaviano-Peri study.
17 Ottaviano and Peri (2012) do not
report the short-run wage effects. However, the algebra of the nested
CES framework implies that it can be easily calculated from the reported
long-run wage effects. In particular, the difference between the two
effects (for
any education group) must equal capital’s share of
income (or an assumed 0.3) times the percent increase in total supply
due to immigration (which their Table 1 suggests is slightly above 10
percent). Hence the short run wage effect exceeds the long run wage
effect by around 3 percentage points.
18 See also Ottaviano and Peri (2012).
19 Goldin and Katz (2008) also
examined the possibility that there may have been a linear decline in
the value of this elasticity of substitution over the 20th century.
Specifically, they add a few pre-1963 data points to the time series,
and introduce a variable that interacts relative supply with the time
trend, and the coefficient of this interaction is negative. As the table
shows, however, the post-1963 Goldin-Katz data leads to an inverse
elasticity that is significantly different from zero and numerically
important.
20 Coincidentally, Alan Krueger happens to be the current Chairman of President Obama’s Council of Economic Advisers.
21 The formulas presented in this section are derived in Borjas (1995).
22 The formula implies that the total
payment to immigrants equals $1.58 trillion. This prediction is very
close to what immigrants actually received in terms of total earned
income (plus benefits). The 2011 ACS indicates that immigrants received
$1.008 trillion in total earned income (in February 2013 dollars). The
BLS reports that wages and salary account for 69.2 percent of total
compensation, implying that the total compensation received by
immigrants is around $1.46 trillion.
23 The magnitude of the “net” gain
accumulating to immigrants is given by the difference between their
income in the United States and what they would have earned in the
source countries had they not migrated.
24 The total labor supply shifts
reported in the last column of Table 3 are a weighted average of the
education-specific supply shifts, using income shares as the weights.
Total immigration increased labor supply by 10.6 percent over the
1990-2010 period, while legal immigration increased labor supply by only
8.0 percent. Legal immigration, therefore, accounted for 75.5 percent
of all immigration (or the ratio of 8.0 to 10.6), implying that
undocumented immigration accounted for 24.5 percent.
25 The exercise summarized in Table 9
ignored the fact that the workforce is not composed of equally skilled
workers. Several studies in the academic literature generalize the
framework to allow for the existence of several skill groups. These
generalizations of the basic model typically find that the immigration
surplus is of roughly the same magnitude as that indicated by the
simpler approach summarized here. See, for example, Borjas (1995) and
Johnson (1998).
