The Holdren ‘cherry blossom vortex’, Information Quality Act, and U.S. weather history
CEI is taking John Holdren to task over his “polar vortex” video.In a post today at globalwarming.org we have this:

DC’s cherry trees hit their official peak blossom date last Thursday, April 10th. That’s the latest in the year that the Capital has experienced peak blossoming in over two decades. (For you botanical historians, the last time that peak blossoming occurred this late or later was in 1993, when the event fell on April 11.)
In 2013 the blossoms were almost as late, hitting their peak on April 9. That was a pretty dramatic change from 2012, when the date fell on March 20. This change was most disconcerting to two groups: tourists trying to plan their trips to DC in advance, and global warming alarmists who trumpeted every earlier-than-expected cherry blossom as yet further proof of global warming. In fact, in a sizzling multi-part blog post series last year, followed by dozens of readers, we charted peak blossom dates against global warming data. We even had graphs. (See Adam Sandberg, Peak Bloom Is Here – DC’s Global Warming Canary Lands with Frost on its Feet, April 15, 2013.)
White House Science adviser John Holdren made some ridiculous and baseless claims about the “polar vortex” being tied to climate change in a hastily produced “never let a good crisis go to waste” style video on YouTube. Readers may recall our January 8th WUWT story:
The White House gets into the ‘polar vortex’ climate change blame business
So as the post at globalwarming.org posits:
We suspect that Holdren’s agency, the Office of Science and Technology Policy (OSTP), may now have a second video in the works in this Blame-Everything-On-Global-Warming series. Perhaps they’ll call it Delayed Peak Blossoming Explained in 2 Minutes.
I get word from our friends at the Competitive Enterprise Institute (CEI) that they are taking the claims made by Holdren in that January video to task. CEI is targeting two claims made in WH videos and blog posts:
“A growing body of evidence suggests that the kind of
extreme cold being experienced by much of the United States as we speak is a pattern that we can expect to see with increasing frequency as global warming continues.”
We also seek to correct a January 8th OSTP blog post by OSTP Senior Communications Advisor and Web Editor Becky Fried that features the above Polar Vortex Explained video.
We request a correction of its claim that “we also know that this week’s cold spell is of a type there’s reason to believe may become more frequent in a world that’s getting warmer, on average, because of greenhouse-gas pollution.”Despite the widespread criticism that this claim has received, the video and a related claim are still up on OSTP’s website. The CEI petition uses OSTP’s own regulations (and the Information Quality Act) to request that this misinformation be corrected.
The late onset of cherry blossoms in DC made CEI wonder whether Holdren would soon be releasing a video attributing that to global warming as well.
CEI has a short blog post on this at http://www.globalwarming.org/2014/04/14/will-cherry-blossoms-get-sucked-into-the-polar-vortex/
The blog post links to the OSTP correction request, which can also be found at:
http://cei.org/sites/default/files/Data%20Quality%20Act%20Request%20to%20OSTP%20about%20Holdren’s%20claims%20regarding%20cold%20winter%20weather%204-14-14.pdf
We expect OSTP to shortly post the request on its website.
Just a reminder, we’ve experienced all this before:
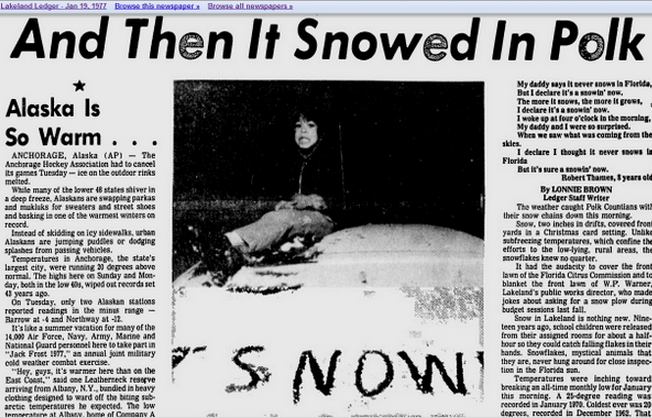
In 1977, a nearly identical pattern set up with warmth in Alaska, drought in California, and cold in Florida. Arctic sea ice was near a peak at the time. (h/t Steve Goddard)
And then there’s the winter of 1963, the most “savage winter of the century” according to Life Magazine on February 8th, 1963:
The Lewiston Journal – Google News Archive Search
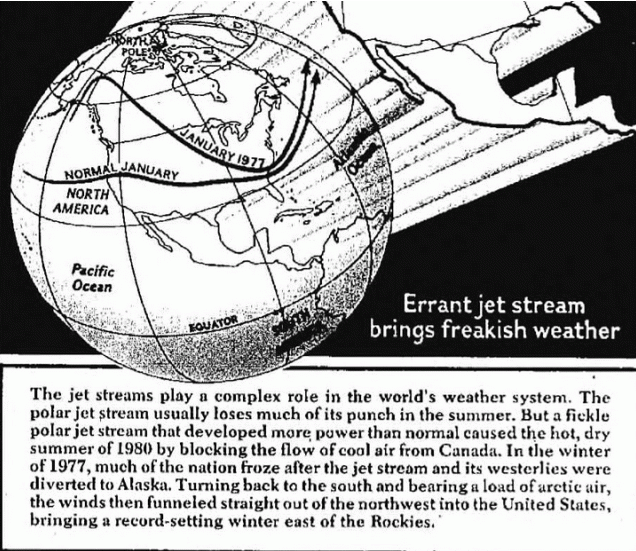

And this illustration is from that Life Magazine article on page 33. Gee, that pattern looks familiar.

Illustration for Life Magazine by Walter Hortens
Those who do not study weather history are condemned to bloviate it as yet another effect of “global warming”.
No comments:
Post a Comment